


What do number 666, 1175 and 1032 numbers have in common? They’re obviously nice number for punters wishing to strike jackpot at 4D betting outlets. As the Chinese Lunar New Year is around the corner, perhaps placing a small bet on those numbers isn’t a bad idea after all. But in the U.S. stock markets, those numbers are disastrous.
With very few investors realized that the 666 points – believed to be a devil number used to invoke Satan – tumble last Friday was actually the beginning of something huge, the world stock markets were awestruck with a subsequent 1,175 points plunge on Monday. Still, like any apocalypse, people weren’t convinced the party is finally over.
Tuesday and Wednesday failed to deliver the expected recovery one would hope for in order to convincingly rubbish a stock meltdown is happening. Thursday pretty much confirms that the Super Bull Run is over. And as the bull is licking its wound, it would take a while before the bullish market – if ever there will be one to continue with – could stage a comeback.
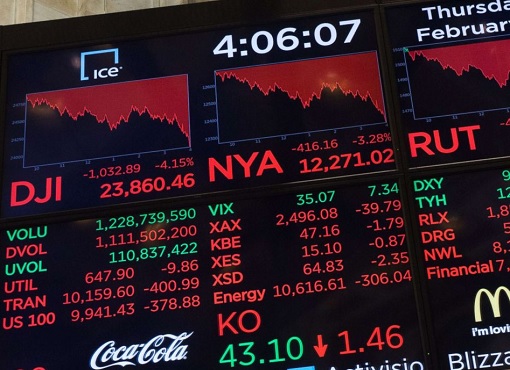
After much bickering, now everyone agrees though, that the U.S. stock markets are entering the correction stage, after DJIA (Dow Jones Industrial Average) erased 1,032.89 points at the closing bell on Thursday. This is the third drop of greater than 500 points for Dow in the last 5 days. But what is impressive – and scary – is not the Dow but the S&P 500.
With S&P 500 – a stock market index based on the market capitalizations of 500 large companies – pulling back 3.75% or 100.66 points to close at 2,581, the stocks look even gloomier. After breaking below its 50-day moving average on Monday, S&P 500 has essentially broke 100-day moving average on Thursday, not to mention closing below 2,600 thresholds.
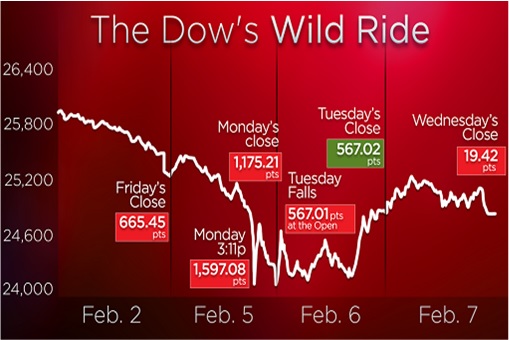
While Friday’s 665.75 points drop was mind-boggling, the Monday’s 1,175 becomes the biggest drop in points in a single day ever in the history of U.S. stock markets. Thursday’s 1,032 points loss is now the second worst, a stunning milestone within 5 days of stocks trading on Wall Street. The third place remains with 777.68 points crash during financial crisis on 28 September 29, 2008.
Again, the Thursday’s 1,032 points plunge, the second collapse of more than 1,000 points in less than a week, was blamed on U.S. Treasury bonds yield. The benchmark 10-year U.S. note yield rose to 2.88% before weakening slightly to 2.851% on Thursday. Analysts, economists and specialists are now worried that the 10-year yields could jump to above 3% fairly quickly.
Mark Cabana, head of U.S. short rate strategy at Bank of America Merrill Lynch, thinks it’s highly likely that the 10-year U.S. note yield would reach the 2.9% level. When that happens, the next level of interest would be 2.98% and then 3.28%. The 10-year is the benchmark best known to investors, and its yield influences a whole range of loans, including home mortgages.
The game is pretty simple to the strategists, investors and fund managers. Like the London Eye giant Ferris wheel, if the bond yields go up, you have to sell stocks. If you sell stocks, and the stocks (hopefully) crash, yields come back down. Then the game at the casino stock markets continue and the process repeats again.
However, the tricky part is that nobody knows how much shares to sell, hence the crash, in order for the yields to come down in a meaningful way so that both stocks and bonds markets find the “correct equilibrium” – and thereafter stabilizes. But the main problem is not even that. The question that not even investors could answer is how high yields can go from here onwards.
Now that S&P 500 has shed 10%, a whopping US$2.5 trillion in market value has been wiped out from the U.S. stocks market. Globally, US$5.2 trillion (while the rest of the world is bleeding after Thursday’s 1,032 points tumble) has vanished. Still, it would take S&P 500 to lose another US$3.55 trillion – the gain made since Trump election in November 2016.
But why even go there and blame the yields which are spooked by inflation, which in turn is blamed on Federal Reserve, or Trump’s tax reform, or electronic market done by computers, when the real culprit could be the hidden hands – the market makers? Whether it is the humans or computers, the market makers are the biggest trigger of stock market crashes.

Sure, blame it on the CBOE Volatility Index, or VIX, arguably the single most popular trade on Wall Street where tons of people make money by “buy the dip and sell the VIX”. Here’s how they make money. Large investment houses, which also include large insurance companies, have purchased stocks at every opportunity and during every minor pullback.
But at the same time, they also shorted the CBOE VIX amid expectations that market moves would be contained, even as the market continued a steady and spectacular uptrend. And just like the older version of VIX which ultimately caused the “Crash of 1987”, today’s VIX surged to levels so high that it was immeasurable – and eventually crashed!
When the stocks market crashed on Monday, the so-called VIX tumbled 85%. And who was the market maker of VIX? It’s none other than big boy Credit Suisse. Although the Credit Suisse has since pulled the plug on the gambling game called VIX, SEC filing shows that partners in crime includes top holders Deutsche Asset Management, Citadel Advisors, Flow Traders, and Two Sigma.

Other Articles That May Interest You …
- Stocks Crash!!! Lost 1,175 Points – Computers Help Wiped $1 Trillion In 3 Days
- Stock Market Crashed 666 Points – Why It’s Very Rare But Not Scary Enough
- Goldman Sachs – Party Is Over, Stock Market Correction Coming In Months
- Get Ready For A Currency War – Trump Wants To Make American Dollar Weak Again
- Something Is Very Wrong!! – World’s Richest 1% Grab 82% Of Global’s Wealth
- U.S. Household Debt Hits Record $12.84 Trillion – China Top Owner Of I.O.U. Papers
- US$1.021 Trillion – Americans’ Credit Card Debt Hits History High
- Here’s Why You Should Get Out Of Stock Market Now – Before The Volcano Erupts!

|
|
February 9th, 2018 by financetwitter
|


|

|

|

|

|

|


Comments
Add your comment now.
Leave a Reply