


 Even analysts and portfolio managers who only looked at fundamental research and didn’t believe at all in technical analysis would look at this one indicator. These portfolio managers and analysts that work for big mutual funds, pension plans and hedge funds represent the institutional money in the market, and they are considered the “big players” in the market place. Regardless whether you like it or not, these “big players” feel comfortable putting money to work in a stock market when they are trading above their 200-day MA. So you better follow these market makers unless you plan to burn all your hard-earned money into the chimney.
When the stock or market falls below the 200-day MA, the big-boys are less likely to put new money to work in that particular stock or market or to defend their position if the stock or market drops. This behavior repeats itself without fail so knowing the pattern is one of the pre-requisities for traders or investors like you and me.
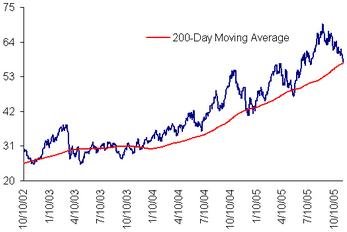
So, you have to remember that the 200-day MA is the cut-off in determining whether a stock or market is in a bull market or a bear market. You should take long trades after you get a buy signal ONLY if the stock or market is above its 200-day MA. Also, you should take short positions after you get a sell signal ONLY if the stock or market is below its 200-day MA. What is so special, you might ask, about this 200-day MA compare to other technical indicators, which will tell you whether we’re in bull or bear market? The main reason has already been stated above, that is majority follows the pattern. But most importantly it’s the perception and the psychological factors that will move the stock in an unstoppable big-wave. You simply can’t fight against the strength of the current.
And rest assured that this indicator was being tested over and over again by thousands of analysts before. It’s proven to be highly reliable. Of course you might want to mix 200-day MA with other technical indicators to give you a higher percentage of accuracy and comfort before you decided to dive into the stocks.

|
|
March 21st, 2007 by financetwitter
|


|

|

|

|

|

|


Hello stocktube!
Just want to leave a note here saying that I have made reference to this post of yours from my latest post.
Best wishes
Boon