


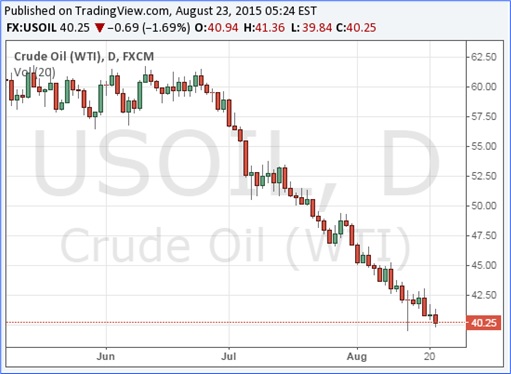
Dow plunges 530.94 points on Friday. With more than 1,000-point drop this week, this was the largest weekly drop since Oct 10, 2008 for Dow. Crude oil prices briefly dropped below US$40 a barrel on Friday, the lowest seen since the financial crisis. The effect of devaluation of the Chinese Yuan has finally reached the United States.
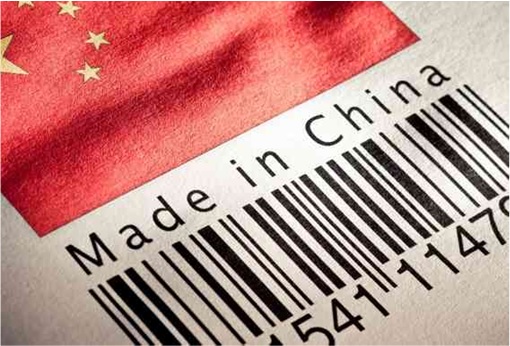
Not only China’s economy is slowing, but recessions in Latin America countries – Brazil and Chile – are not helping the situation. The scariest part was, of course, the latest manufacturing data from China. The idea was this – if China’s manufacturing is slowing, it means consumption is struggling.
The Caixin-Markit China Manufacturing Purchasing Managers’ Index (PMI), dropped to 47.1 in the first 3-weeks of August, down from 47.8 in July, its worst reading since the depths of the financial crisis. This is one of the most independent data available to analysts and economists who wanted to know the health of China’s economy.
Here’re some charts that are spooking economies around the world. And this could be just the beginning. Some said China is going through what the America had gone through during the 1929 Depression. It may or may not be true, depending on how the Chinese plans to combat this slowdown, which they have zero experience of doing so, historically speaking.
{ 1 } Shanghai Composite Index Tumbles
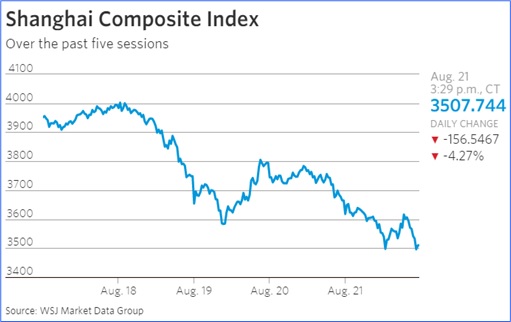
When China devalues its currency last week on 11 Aug, 2015, its stock market should rejoice and rebound. It did for a while, but has been dropping like a rock for the last 5-days, erasing 156-points.
{ 2 } Emerging Market Currencies Collapse

Instead of going up and feel proud of it, developing countries are doing exactly the opposite. They’re competing to make their currencies go down. After China, Vietnam became the second country in Asia devaluing its Dong, follows by Kazakhstan. Malaysia’s ringgit weakened to a 17-year low, the worst developing-nation performance this month after Russia’s ruble.
{ 3 } Commodities Plunge to 13-Year Low
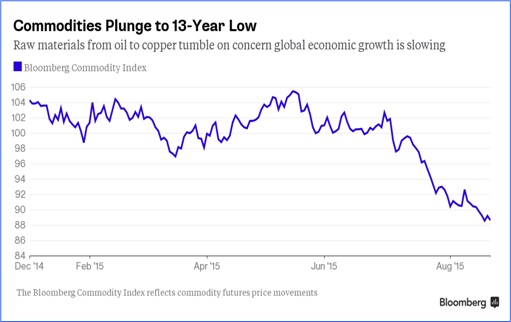
Copper, steel, oil, nickel, zinc, aluminium, tin are some of the main commodities in huge demand during China’s bullish period. China’s growth is synonym with prices of these commodities. If the Bloomberg Commodity Index is any indicator, the consumption by China is at its lowest since 2002.
{ 4 } Global Stocks Wipe Out This Year’s Gain
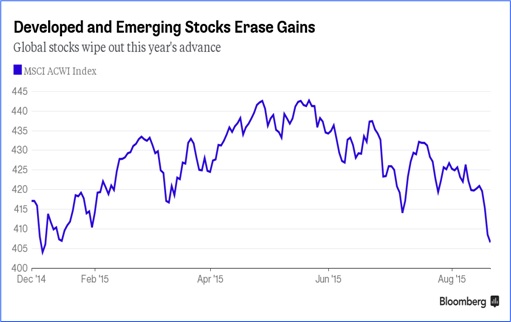
European stock markets have officially entered its correction stage. This week’s Thursday and Friday plunge could be the beginning of a serious U.S. stock market plunge. Stock markets in Hong Kong, Indonesia, Taiwan and Malaysia have also entered bear markets.
{ 5 } Gold Skyrockets
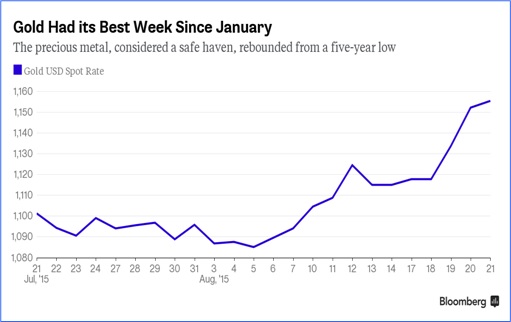
Gold, traditionally a safe haven during uncertainties and crisis skyrockets the most in 7-months this week alone, from a 5-year low. Investors are now betting there will be no interest rate hike at all this year, hence pumping their money into the precious metal. That’s what they normally do when they’ve nowhere to park their money.
{ 6 } U.S. Treasury Yields Collapse
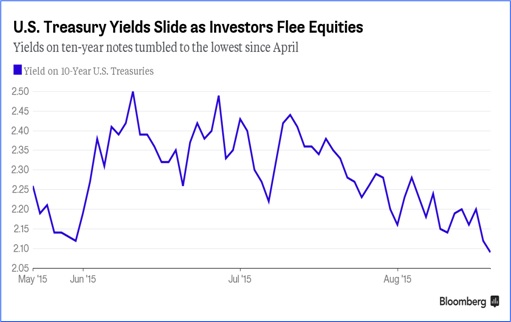
As demand skyrockets, U.S. Treasury yields on 10-year notes plunged to the lowest since April this year. Besides gold, investors are dumping their money into fixed income after selling off their shares. From Australia to Britain, all the government debts were snapped up like hot cake.
{ 7 } Caixin-Markit China PMI Collapse
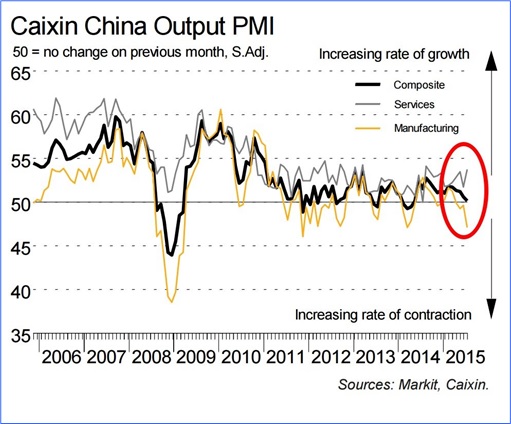
A PMI index released by Markit showed that growth in the US manufacturing sector slowed unexpectedly to its weakest pace in almost two years in August, dipping to 52.9 from 53.8 in July. The latest Caixin-Markit China Manufacturing Purchasing Managers’ Index (PMI) also showed its worst reading since the U.S. financial crisis in 2008.
{ 8 } Bloomberg Billionaire Index Collapse

Bloomberg has started tracking the world’s 400 richest people via its Bloomberg Billionaire Index since September 2014. These 400 people have lost US$182 billion this week, the biggest since the creation of the index. On Friday alone, they have lost US$76 billion. As bad as it looks, they still have US$3.98 trillion in net worth. China’s 26 richest people have lost US$18.8 billion during the week.
Other Articles That May Interest You …
- Flashback Of 1997 & Today’s Financial Crisis – Here’s Why You Should Be Scared
- Here’s Why China’s Yuan Devaluation Is Such A Big Deal
- The Seven Hundred Million Dollar Man’s Fate Depends On The Ringgit
- A Remaking Of 1997 Asian Financial Crisis By Najib Razak In 2015
- Can You Guess 7 U.S. Tech Companies Founded After 1970, But Worth Above US$100 Billion?
- The Chinese Are Coming!! The Chinese Are Coming!!

|
|
August 23rd, 2015 by financetwitter
|


|

|

|

|

|

|


Comments
Add your comment now.
Leave a Reply