


Today is Thursday and by normal convention, you should be happy. Tomorrow you should be happier and of course, the next subsequent day as we enter the weekend, it should be the happiest day of the week. But when are the sad days within a week, month or even a year? Enter Google search interest – where anxiety, stress, fatigue, depression and pain search patterns were used to tell us when we’re mostly miserable.
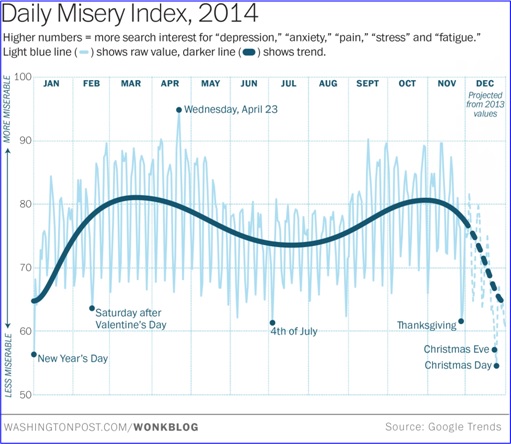
With the five items used to plot a chart into an “Index of Misery”, we now know roughly the trend of your sadness. Looking at the chart above, higher numbers (more miserable) mean greater search interest in either anxiety, stress, fatigue, depression or pain. In other words, the higher volume in search for such words would indicate the greater unhappiness people were throughout the year.
As a start, people are happiest as new year starts and ends, for obvious reasons. You have New Year’s Day as January starts and Christmas season towards the end of November. Hence, the least miserable day of the year actually starts in the month of December and lasts till the New Year’s celebration. Heck, it’s safe to say that the productivity drops like a rock in the whole month of December itself.

Besides Christmas, December is also the month of school holidays, year-end mega sales, stock clearance sales, bonuses and whatnot. The month of March and October are the most miserable months in a year. The logical explanation could be due to job expectations. March normally is the month where the first quarter sales are released and if the number doesn’t exceed expectation or estimation, subsequent months would be stressful.
Similarly, October is the last month of the calendar year for you to start pushing deliveries from pipeline or funnel numbers to fulfil the last quarter sales of the year. Knowing December will be holiday season, companies and employees are pressured to clear inventories and collect payments before the year ends. June and July are lesser stressful months, probably because the first quarter pressure is long gone while the coming quarters are still far away.
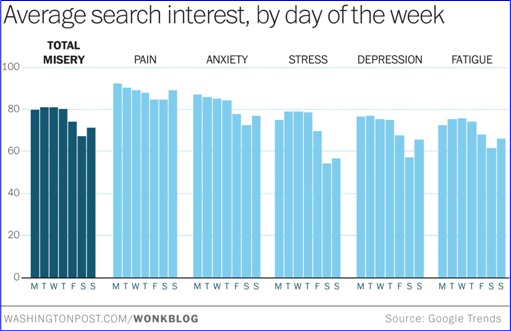
Interestingly, the spiky light blue line shows the trend or rhythm of the weeks in a year. Needless to say, people are more miserable on weekdays, less so on weekends. Thanks to Monday blues and Thursday weekend-eve, Tuesday and Wednesday are your most miserable day of the week. But we supposed you already knew that. But do you know that the five items of misery rule the 7-days differently?

For example, “pain” and “anxiety” peak on Mondays, while “stress” and “depression” rule the chart on Tuesdays. Fatigue is the champion on Wednesdays. All the five items of misery drop sharply going into the weekend, before going up again on Sunday (*grin*). Thus, the happiest day is, as expected, Saturday. Besides Saturday, the next day which brings happiness is without doubt – public holidays.

Nevertheless, the misery index chart will definitely shows sudden spikes in the event of unprecedented news or incidents. For example, the death of Robin Williams or any of your idols. Or perhaps a sudden tax hikes by your government which could affect your lifestyle tremendously. Should there be a global economic recession or depression, surely there would be less happy days, what more if you got laid off or retrenched.

Other Articles That May Interest You …
- From $7,000 To $16,000 / Month – That’s How Much Internships Are Paid
- Mystery Solved!! – Why Certain People Say & Do The Stupidest Things
- Revealed – Why Facebook Mark Zuckerberg Wears The Same Shirt Every Day
- These 50 Graphs Are Funny But Freaking True About Life
- Another Reason To Eat More Chocolate – It Can Reverse Memory Loss
- Here’re 22 Product Packaging Fails That Are Too Hilarious
- A Guy With Balls Of Steel, Emailed His Boss For A $10,000 Raise – For Everyone

|
|
December 4th, 2014 by financetwitter
|


|

|

|

|

|

|


Comments
Add your comment now.
Leave a Reply