


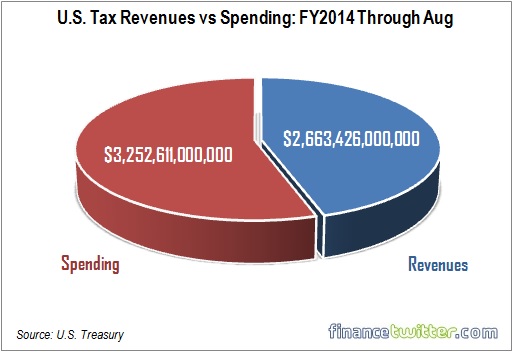
Here are the good news and the bad news released by the United States Treasury. Congratulations to President Barack Obama – his administration has just delivered a new record in collection. Inflation-adjusted federal tax revenues hit a record US$2,663,426,000,000 for the first 11 months of the fiscal year this August. If you don’t know how much is that figure, it’s not in billion. In short, that is a mind-boggling US$2.66 trillion dollars.
That’s an awesome figure. Unfortunately, that’s not enough to cover the world superpower’s hunger for money, because its expenses were at even bigger figure – US$3,252,611,000,000. So, here’s the bad news – Obama administration is still in deficit of a whopping US$589,185,000,000. That’s another US$589 billion spending which could not be covered from the various taxes and income.
The largest share of tax revenue for the year has come from individual income taxes, which amounted to US$1,233,274,000,000 in the first 11 months of fiscal 2014. What this means is that over 46% of the US$2.66 trillion in revenue collected were from the American people. The Americans paid 46% in income tax to the pool. Here’re the summary of other revenues collected:
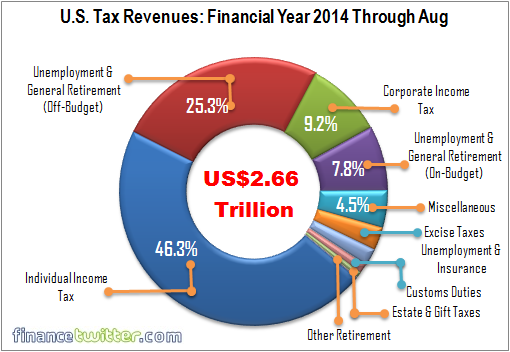
- Corporation Income Taxes – US$247,200,000,000
- Employment and General Retirement (off-budget) – US$674,338,000,000
- Employment and General Retirement (on-budget) – US$209,281,000,000
- Unemployment Insurance – US$54,591,000,000
- Other Retirement Receipts – US$3,155,000,000
- Excise Taxes – US$73,051,000,000
- Estate and Gift Taxes – US$17,702,000,000
- Customs Duties – US$30,902,000,000
- Miscellaneous Receipts – US$119,933,000,000
Interestingly, the US$2,663,426,000,000 or the US$2.66 trillion that the U.S. federal government collected from October through August in fiscal year 2014 was US$134,705,540,000 more than the US$2,528,720,460,000 it collected in October through August in fiscal year 2013. Should the extra US$134 billion wasn’t there, Obama administration would ran into a bigger deficit of US$723 billion.
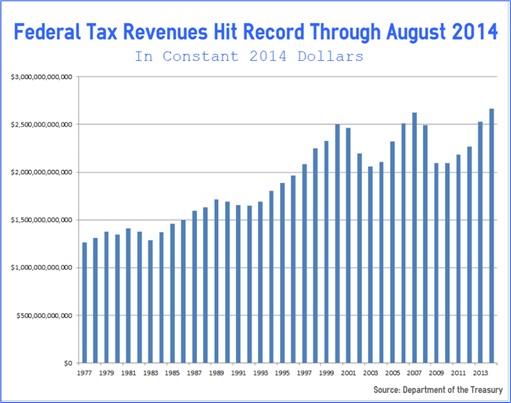
According to the Treasury, the U.S. government collected $1,262,469,450,000 in inflation-adjusted revenue in the first 11 months of fiscal 1977. Hence, since 1977 till today, revenues have more than doubled – increasing by 111%. While this year is the highest in tax revenues, the second highest of such collection happened in 2007. The U.S. government collected $2,622,537,950,000 in 2014 dollars for the first 11 months of fiscal 2007.

The difference between 2007’s record and 2014’s record is $40,888,050,000. If you still remember, the last recession due to subprime crisis happened in December 2007 and ended in June 2009. So, if you look at the chart, right after U.S. registered its supposedly record tax revenues in 2007, but subsequently the recession hit its bottomline. And now with the additional spending to fight ISIS, the deficit for next year is expected to be more, obviously.
Other Articles That May Interest You …
- Here’re The Reasons For The Burger King-Tim Hortons “Combo Deal”, It’s Not Just Tax
- Here’s What $100 Is Actually Worth In Each State Of America
- Stunning Revelation – Canadian Taxes Increase By 1,832% Since 1961
- Are You Holding The World’s Most Powerful Passport?
- Apple Has More Cash Than Malaysia, France & Dozens Other Countries
- Here’re Tax Havens To Hide Your Black Money & Plunder
- U.S. Debt – How Much Does Each American Owe?
- 15 World’s Biggest Gold Reserves Cheering Record Price

|
|
September 14th, 2014 by financetwitter
|


|

|

|

|

|

|


Comments
Add your comment now.
Leave a Reply