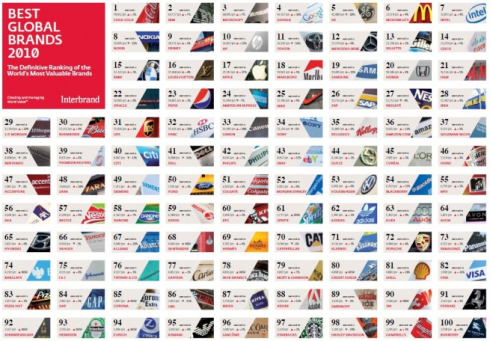
Except for Nokia at 8th position, the top-10 of 2010’s 100 Best Global Brands is dominated by American brands – according to Interbrand agency. For the 11th year in a row, The Coca-Cola Co. ranked as the world’s top performing brand with a value of nearly $70.5 billion. The second and third place also remain unchanged – IBM and Microsoft Corp. with value of $64.7 billion and $60.9 billion respectively.
BMW maintains its 15th position, behind Toyota (at No 11) and Mercedes Benz (at No 12). Google’s brand value improves by a whopping 36% when it jumped from No 7 to No 4 with value at $43.5 billion. HP made it to the top-10 for the first time. Apple is another company that saw its brand value increases tremendously – by 37% to No 17 while Intel improves to No 7 from 9 previously.
| Rank | Prev Rank | Brand (Company) | Country of Origin | Sector | Brand Value ($M) | Change in Brand Value |
| 1 | 1 |  |
United States | Beverages | 70,452 | 2% |
| 2 | 2 |  |
United States | Business Services | 64,727 | 7% |
| 3 | 3 |  |
United States | Computer Software | 60,895 | 7% |
| 4 | 7 |  |
United States | Internet Services | 43,557 | 36% |
| 5 | 4 |  |
United States | Diversified | 42,808 | -10% |
| 6 | 6 |  |
United States | Restaurants | 33,578 | 4% |
| 7 | 9 |  |
United States | Electronics | 32,015 | 4% |
| 8 | 5 |  |
Finland | Electronics | 29,495 | -15% |
| 9 | 10 |  |
United States | Media | 28,731 | 1% |
| 10 | 11 |  |
United States | Electronics | 26,867 | 12% |
| 11 | 8 |  |
Japan | Automotive | 26,192 | -16% |
| 12 | 12 |  |
Germany | Automotive | 25,179 | 6% |
| 13 | 13 |  |
United States | FMCG | 23,298 | 2% |
| 14 | 14 |  |
United States | Business Services | 23,219 | 5% |
| 15 | 15 |  |
Germany | Automotive | 22,322 | 3% |
| 16 | 16 |  |
France | Luxury | 21,860 | 4% |
| 17 | 20 |  |
United States | Electronics | 21,143 | 37% |
| 18 | 17 |  |
United States | Tobacco | 19,961 | 5% |
| 19 | 19 |  |
South Korea | Electronics | 19,491 | 11% |
| 20 | 18 |  |
Japan | Automotive | 18,506 | 4% |
| 21 | 21 |  |
Sweden | Apparel | 16,136 | 5% |
| 22 | 24 |  |
United States | Business Services | 14,881 | 9% |
| 23 | 23 |  |
United States | Beverages | 14,061 | 3% |
| 24 | 22 |  |
United States | Financial Services | 13,944 | -7% |
| 25 | 26 |  |
United States | Sporting Goods | 13,706 | 4% |
| 26 | 27 |  |
Germany | Business Services | 12,756 | 5% |
| 27 | 25 |  |
Switzerland | Beverages | 12,753 | -4% |
| 28 | 28 |  |
Sweden | Home Furnishings | 12,487 | 4% |
| 29 | 37 |  |
United States | Financial Services | 12,314 | 29% |
| 30 | 30 |  |
United States | Alcohol | 12,252 | 4% |
| 31 | 31 |  |
United States | Transportation | 11,826 | 2% |
| 32 | 32 |  |
United Kingdom | Financial Services | 11,561 | 10% |
| 33 | 33 |  |
Japan | Electronics | 11,485 | 10% |
| 34 | 29 |  |
Japan | Electronics | 11,356 | -5% |
| 35 | 34 |  |
United States | FMCG | 11,041 | 6% |
| 36 | 43 |  |
United States | Internet Services | 9,665 | 23% |
| 37 | 38 |  |
United States | Financial Services | 9,372 | 1% |
| 38 | 39 |  |
Japan | Electronics | 8,990 | -2% |
| 39 | 40 |  |
Canada | Media | 8,976 | 6% |
| 40 | 36 |  |
United States | Financial Services | 8,887 | -13% |
| 41 | 35 |  |
United States | Electronics | 8,880 | -14% |
| 42 | 42 |  |
Netherlands | Electronics | 8,696 | 7% |
| 43 | 46 |  |
United States | Internet Services | 8,453 | 15% |
| 44 | 41 |  |
Italy | Luxury | 8,346 | 2% |
| 45 | 44 |  |
France | FMCG | 7,981 | 3% |
| 46 | 48 |  |
United States | FMCG | 7,534 | 4% |
| 47 | 45 |  |
United States | Business Services | 7,481 | -3% |
| 48 | 50 |  |
Spain | Apparel | 7,468 | 10% |
| 49 | 47 |  |
Germany | Diversified | 7,315 | 0% |
| 50 | 49 |  |
United States | Automotive | 7,195 | 3% |
| 51 | 52 |  |
United States | FMCG | 6,919 | 6% |
| 52 | 57 |  |
United States | Financial Services | 6,911 | 8% |
| 53 | 55 |  |
Germany | Automotive | 6,892 | 6% |
| 54 | 63 |  |
Canada | Electronics | 6,762 | 32% |
| 55 | 54 |  |
United States | Media | 6,719 | 3% |
| 56 | 53 |  |
France | Financial Services | 6,694 | 3% |
| 57 | 58 |  |
Switzerland | FMCG | 6,548 | 4% |
| 58 | 60 |  |
France | FMCG | 6,363 | 7% |
| 59 | 56 |  |
United States | Electronics | 6,109 | -5% |
| 60 | 61 |  |
United States | Restaurants | 5,844 | 2% |
| 61 | N/A | United States | Beverages | 5,777 | 0% | |
| 62 | 62 |  |
Germany | Sporting Goods | 5,495 | 2% |
| 63 | 65 |  |
Germany | Automotive | 5,461 | 9% |
| 64 | 67 |  |
United States | FMCG | 5,072 | 3% |
| 65 | 69 |  |
South Korea | Automotive | 5,033 | 9% |
| 66 | 64 |  |
United States | Internet Services | 4,958 | -3% |
| 67 | 81 |  |
Germany | Financial Services | 4,904 | 28% |
| 68 | N/A |  |
Spain | Financial Services | 4,846 | 0% |
| 69 | 70 |  |
France | Luxury | 4,782 | 4% |
| 70 | 66 |  |
United States | Diversified | 4,704 | -6% |
| 71 | 71 |  |
United States | FMCG | 4,536 | 3% |
| 72 | 74 |  |
Germany | Automotive | 4,404 | 4% |
| 73 | 75 |  |
Japan | Electronics | 4,351 | 3% |
| 74 | N/A |  |
United Kingdom | Financial Services | 4,218 | 0% |
| 75 | 80 |  |
United States | FMCG | 4,155 | 8% |
| 76 | 76 |  |
United States | Luxury | 4,127 | 3% |
| 77 | 77 |  |
France | Luxury | 4,052 | 2% |
| 78 | N/A |  |
United States | Alcohol | 4,036 | 0% |
| 79 | 82 |  |
France | Alcohol | 4,021 | 7% |
| 80 | N/A |  |
Switzerland | Financial Services | 4,010 | 0% |
| 81 | 92 |  |
Netherlands | Energy | 4,003 | 24% |
| 82 | 94 |  |
United States | Financial Services | 3,998 | 26% |
| 83 | 79 |  |
United States | Restaurants | 3,973 | 2% |
| 84 | 78 |  |
United States | Apparel | 3,961 | 1% |
| 85 | N/A |  |
Mexico | Alcohol | 3,847 | 0% |
| 86 | 72 |  |
Switzerland | Financial Services | 3,812 | -13% |
| 87 | 86 |  |
Germany | FMCG | 3,734 | 5% |
| 88 | 95 |  |
United States | Computer Software | 3,626 | 15% |
| 89 | 84 |  |
United Kingdom | Alcohol | 3,624 | -2% |
| 90 | N/A |  |
United States | Diversified | 3,586 | 0% |
| 91 | 88 |  |
Italy | Automotive | 3,562 | 1% |
| 92 | N/A |  |
United Kingdom | Alcohol | 3,557 | 0% |
| 93 | N/A |  |
Netherlands | Alcohol | 3,516 | 0% |
| 94 | N/A |  |
Switzerland | Financial Services | 3,496 | 0% |
| 95 | 89 |  |
Italy | Luxury | 3,443 | 4% |
| 96 | 91 |  |
France | FMCG | 3,403 | 5% |
| 97 | 90 |  |
United States | Restaurants | 3,339 | 2% |
| 98 | 73 |  |
United States | Automotive | 3,281 | -24% |
| 99 | 100 |  |
United States | FMCG | 3,241 | 5% |
| 100 | 98 |  |
United Kingdom | Luxury | 3,110 | 0% |
Luxury brands such as Louis Vuitton (No 16), Gucci (No 44), Tiffany & Co (No 76) and Armani (No 95) all saw the value of their brands increase in 2010. The Gulf oil spill prompted BP to exit the list after being on the list for nine years, leaving Shell (No 81) as the biggest brand in the category.
Other Articles That May Interest You …
- RIM Beat Forecasts, BlackBerry is Not Dead Yet
- Gartner’s Prediction on Mobile OS Top Market Shares
- Apple Special Event – 20 Things That May Interest You

|
|
September 18th, 2010 by financetwitter
|


|

|

|

|

|

|



















[…] Top 100 Best Global Brands – Technology Co. Rules Apple Inc., Finance and Economy, Google Inc., Investing & Trading, Make Money Online, Option Trading, Technology Stock […]