


We’re approaching end of the month of March and a lot of events with great impact on the market will take place. Brexit deadline, US debt ceiling, trade war with China will be on the spotlight in the next few weeks.
Until then, today we want to show a technical analysis of the most popular pairs and hopefully, it will manage to give a clearer picture of currency trading.
EURUSD
Since mid-November, the price action had been locked in an ascending channel formation, which had been broken on the downside on February 7th. Looking at the overall price action context, we see that bears had been in control since August last year, considering that more than 80% of the candles are located below the 4h chart 200 moving average.
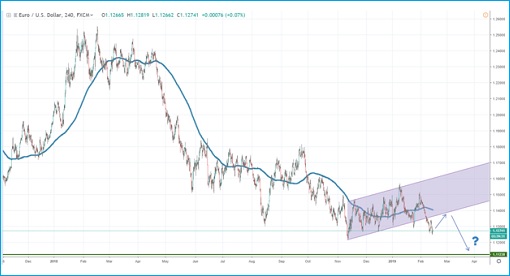
Source: tradingview.com
EURUSD technical analysis
We expect the buyers might be able to retest the broken channel, were a significant supply zone might be located. Since there is no outcome yet on Brexit, the euro could continue to be under pressure. We believe the pair will gradually move lower, towards the 1.1120-1.1100 area, where stronger buyers might step in.
USDCHF
As opposed to EURUSD, the outcome for USDCHF seems to lead to a breakout and continuation higher. If we analyze the price action until February last year, the buyers had been the ones in control, with a big ascending triangle formation possibly signaling a short squeeze and a potential break above the 1.0064-1.0106 key resistance area.
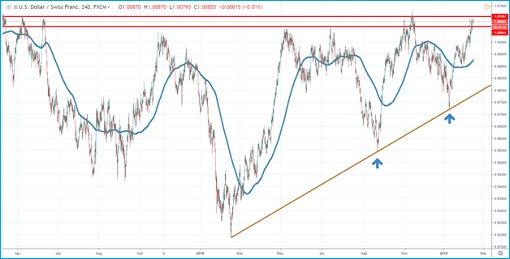
Source: tradingview.com
USDCHF technical analysis
We can see how buyers stepped in at a higher level, communicating the selling pressure is getting weaker and weaker. As long as the price will stay above our ascending trend line, the likelihood of a breakout higher will increase as time goes by.
GBPUSD
Cable continues to be locked in a downward price channel, as the Brexit outcome is still uncertain. Sellers had been stepping in each time the price had reached the upper line of the channel, communicating there still huge supply after each rally.
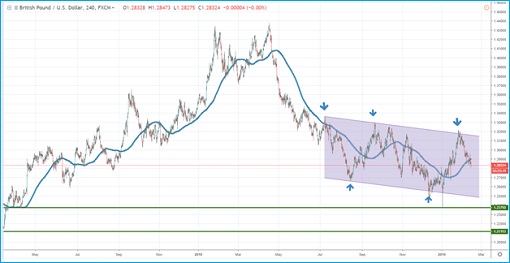
Source: tradingview.com
GBPUSD technical analysis
Currently, the price sits under the 4h chart 200 moving average and we suspect it will gradually continue to move towards the lower line, or even lower, towards the 1.2375 support.
We see two failed breakout attempts on the downside, which is not an encouraging sign for buyers, considering that the channel structure continues to be in play. More weakness is expected in the following weeks until there will be more political clarity.


|
|
March 16th, 2019 by financetwitter
|


|

|

|

|

|

|


Comments
Add your comment now.
Leave a Reply