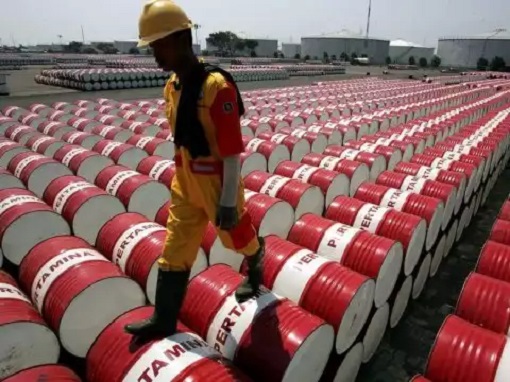
U.S. stocks closed lower Wednesday – both Dow and S&P 500 – suffered their biggest one-day percentage drops since September. The Dow fell 138.19 points while the S&P 500 lost 14.25 points. That wasn’t too bad considering both plunges were less than 1%. But the issue here is they crashed primarily due to a sudden drop in oil prices – a nearly 5% plunge.
The U.S. government reported an unexpected increase in crude and gasoline stockpiles. Earlier, the U.S. International Energy Agency (IEA) reported a crude stockpile of 1.9-million barrels – more than an initial forecast. But when the American Petroleum Institute reported a whopping increase of 6.5-million barrels, all hell breaks loose.
To add salt into injury, the IEA cut its oil demand growth forecast by 100,000 barrels per day (bpd) for each year of both 2017 and 2018. That announcement on Tuesday could mean world oil consumption may not breach 100 million bpd next year after all. In fact, the IEA said non-OPEC production would rise 1.4 million bpd in 2018, indicating efforts by OPEC could be undermined.

That view from IEA obviously contradicts OPEC’s projection, which had been released one day earlier. The Saudi-led OPEC raised its forecast for demand growth by 130,000 barrels a day in 2018. The U.S. agency also predicted that oil markets will remain oversupplied in the first half of 2018. It appears that IEA report was specifically targeting the recent rise in crude oil prices.
The report says the 14-member OPEC will struggle with the rising output by producers not aligned to the cartel – particularly from the United States – suggesting that the U.S. will continue to eat the market share. In the week through November 3, the U.S. produced a mind-boggling 9.62-million barrels of oil a day, beating a record high registered in June 2015, just before the oil price crash.
While OPEC and other exporters, including Russia, are keeping about 1.8 million barrels a day out of the market in order to end a persistent glut of crude oil, the U.S. shale drillers have stubbornly frustrated the efforts by OPEC and its partners involved in the plan. If those U.S. producers continue to drill and breach the 10-million barrels mark, it will break the national record held in November 1970.

Speculators, especially those who entered at the tail of the crude oil bull, were caught with their pants down when the commodity plunges following a weaker-than-expected economic data from China. Against market expectation, the Chinese investment growth slowed to 7.3% in the January-October period, suggesting that consumption of oil would be lower going forward.
Besides cutting 1.8 million barrels a day out of the market, a plan which is fast losing steam, Saudi Crown Prince Mohammed bin Salman had also engaged on a secret plan to replenish the kingdom’s coffers – by cracking down on the elite of the House of Saud under the pretext of wiping out corruption. If he succeeded, close to US$800 billion could be confiscated from fellow princes.
But even that political purge appears to be losing steam as the arrests of Saudi royal family and the frozen of thousands of bank accounts have backfired. Princes being cornered are forced to unite against the selective crackdown, arguing that Crown Prince Mohammed and his father King Salman were part of the “corruption system” for decades themselves.

Crown Prince Mohammed’s option to keep crude oil price high is keep beating the war of drum between Saudi Arabia and Iran. This drama, however, can only materialise if Trump administration shows signs of going to war with its ally Saudi. Unfortunately, President Trump’s plate is full and has no appetite, let alone support at the Capitol, for a war as long as he can bring back home business deals from abroad.
The sudden crash in oil price, nevertheless, has triggered some technical indicators in the U.S. stock market. Those flashing indicators – Hindenburg Omen and Titanic Syndrome – haven’t occurred simultaneously since 2007. Interestingly, the flashes happened in 1999, just before the dot-com crash, which wasn’t very delightful scenery.
- Hindenburg Omen: A sell signal that occurs when NYSE new highs and new lows each exceed 2.8% of advances plus declines on the same day. On Tuesday, they totalled more than 3%.
- Titanic Syndrome: A sell signal triggered when NYSE 52-week lows outnumber 52-week highs within seven days of an all-time high in equities. Stocks most recently hit a record on November 8.

Sure, this could be a coincidence – oil plunging, copper sold off, stocks tumbled, dollar weakened and whatnot. It could be just a hiccup or a temporary pull-back of a strong bull market. But you know what will happen when everything seems to be going south. Wall Street can only call this a “weird” phenomenon. But this could be the start of a real huge stock market correction.
Other Articles That May Interest You …
- Replenish Coffers – The $800 Billion Hidden Reason Behind Saudi Corruption Crackdown
- Game Of Thrones – Crown Prince Crackdown On Princes, Alwaleed Arrested For Corruption
- If Oil Goes Above $70, The Complacent & Lazy Saudi Might Not Reform At All
- U.S. Oil Producers Eating Up Asian Market, And There’s Nothing OPEC Can Do
- Here’s Why You Should Get Out Of Stock Market Now – Before The Volcano Erupts!
- U.S. Household Debt Hits Record $12.84 Trillion – China Top Owner Of I.O.U. Papers
- Arabs Played By America – How Trump Sucks Billions Of Dollars Selling Weapons
- The Glory Days Are Over – OPEC Warlord Saudi Has Started Borrowing

|
|
November 16th, 2017 by financetwitter
|


|

|

|

|

|

|


Comments
Add your comment now.
Leave a Reply